What Is Uptime Kuma?
Uptime Kuma is a self-hosted monitoring tool. It has various ways to monitor your service or even your server. You need a Server to deploy or host this Uptime Kuma.
Why did I choose Uptime Kuma?
Because it’s open source, I can host or deploy it on my server. But in my case, I use ClawCloud Run to run Uptime Kuma. ClawCloud will give us $5 every month for everyone whose GitHub account is over 180 days of registration, you will unlock $5 for free every month! No extra usage or money required. $5 gift credits are renewed every month and reserved in your account. Among the following applications, you can enjoy our lifetime free campaign. You can register here, ClawCloud Run, make sure to register with github account that is eligible to get free credits every month.
What is passive push monitoring in Uptime Kuma?
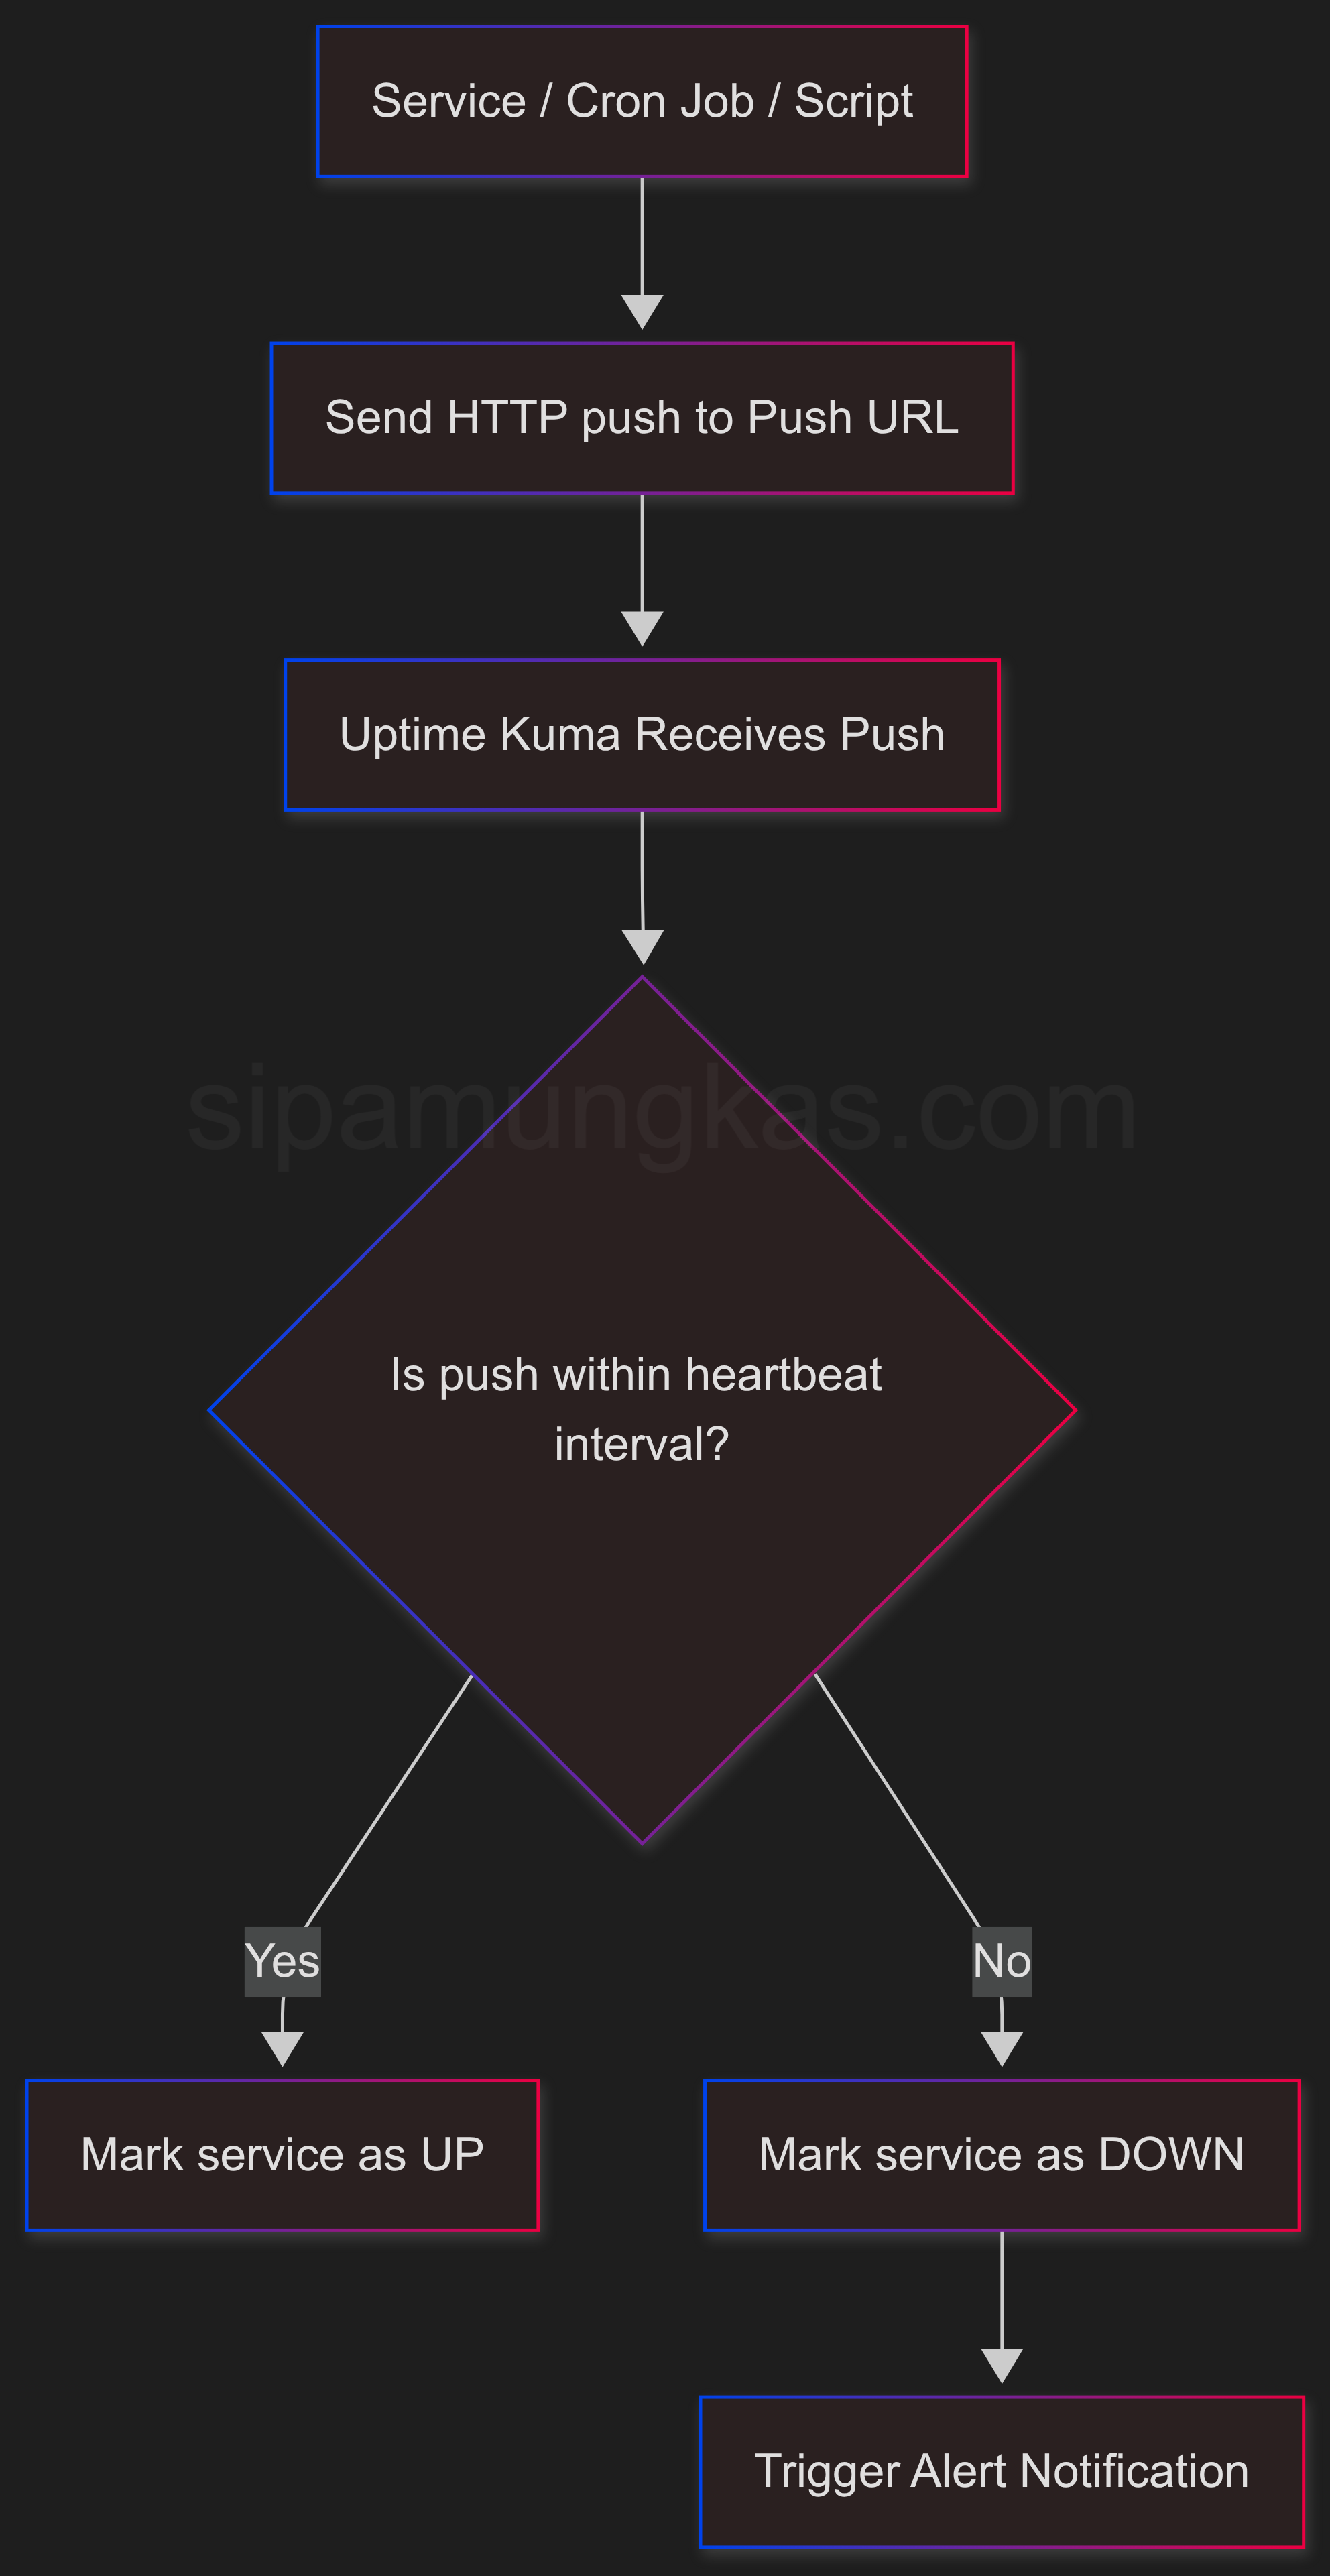
In Uptime Kuma, passive push monitoring is a type of monitoring where the monitored service or device sends “heartbeat” signals to Uptime Kuma to indicate that it’s alive and well, rather than Uptime Kuma actively checking the service.
Here’s a breakdown of what that means and why it’s useful:
How it works:
- Uptime Kuma provides a unique URL (a “push URL”) for each passive push monitor you create.
- Your service/device is configured to periodically send a request (a “push” or “heartbeat”) to this URL. This is often done via a cron job, a script, or an application that makes an HTTP request.
- Uptime Kuma listens for these pushes. As long as it receives pushes within a specified “heartbeat interval,” it considers the service to be “Up.”
- If Uptime Kuma doesn’t receive a push within the defined interval, it assumes the service is down and will trigger alerts.
Why it’s “passive”:
Unlike traditional “active” monitoring (like HTTP, TCP, or Ping checks where Uptime Kuma initiates the connection), in passive push monitoring, Uptime Kuma is passively waiting for the monitored entity to “check in.” It doesn’t actively go out and probe the service.
Key benefits and use cases:
- Monitoring services behind firewalls or NAT: This is a primary use case. If your service isn’t publicly accessible from the internet (where your Uptime Kuma instance might be), you can’t use active monitoring. With passive push, the internal service can still reach out to Uptime Kuma.
- Monitoring cron jobs and background tasks: These don’t typically have a continuously running HTTP server or open port. You can configure a script that runs as part of your cron job to send a push to Uptime Kuma when it successfully completes. This ensures your scheduled tasks are actually running.
- Irregularly running processes: If you have a process that runs only occasionally or at unpredictable intervals, you can set a long heartbeat interval and have the process push a signal when it’s active.
- Resource-constrained devices: For devices with limited resources, it might be more efficient for them to send a simple push than to respond to constant external probes.
- Monitoring execution time: Some push monitors allow you to send a “ping” duration with the push, allowing Uptime Kuma to track how long your script or task took to execute.
In essence, passive push monitoring in Uptime Kuma flips the traditional monitoring model: instead of Uptime Kuma checking on your service, your service checks in with Uptime Kuma. This makes it a very versatile tool for monitoring a wider range of services and processes.
How to Set Up Passive Push Monitoring with Uptime Kuma
-
Make sure you already have the Uptime Kuma service running and can be accessed. If you don’t have this yet, register for ClawCloud Run, go to the market, and choose Uptime Kuma.
-
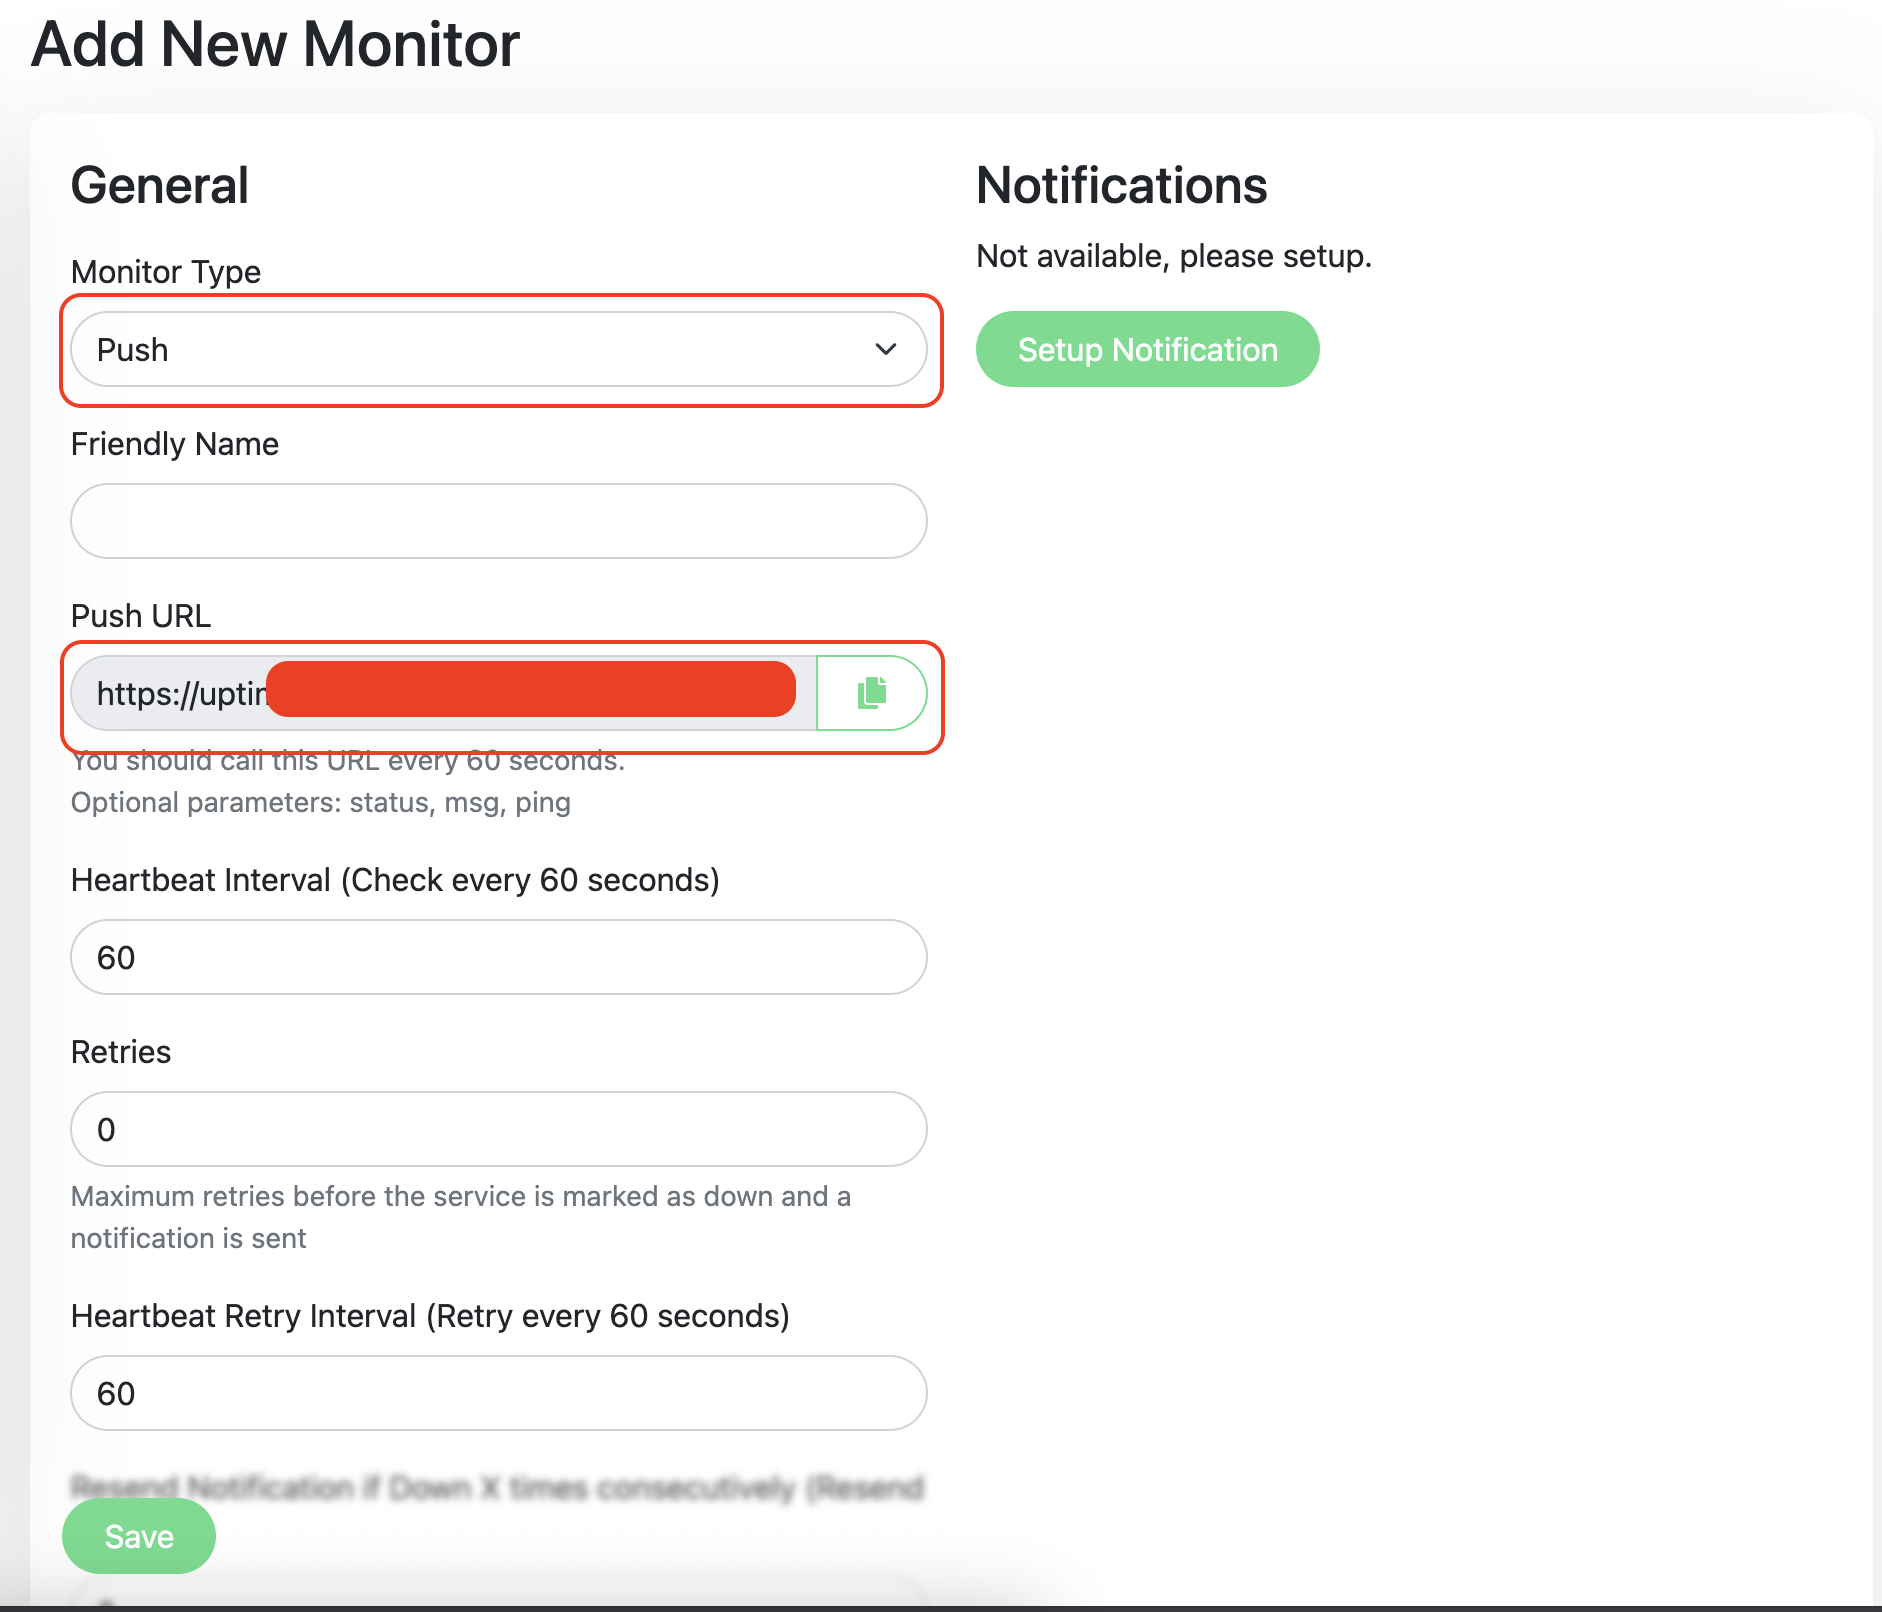
Go to your Uptime Kuma dashboard, choose Add New Monitor
-
In the monitor type, choose Push. After that, fill in the friendly name so it’s easy to remember which monitoring you use. In the push URL field, remember that we will use it to set up a cron job on our server.
curl --version -
If the curl package is already installed, then openthe crontab with this command
crontab -e -
Then add the code below at the end of the crontab config, to get the push URL go to step 3.
# This cronjob will hit the uptime API every minute. # Cronjobs operate with a minimum granularity of one minute. # To achieve a 30-second interval, you would typically need a script # that runs every minute, performs the action, sleeps for 30 seconds, # and then performs the action again. # # The '* * * * *' specifies the schedule: # - *: every minute (0, 1, 2, ..., 59) # - *: every hour # - *: every day of the month # - *: every month # - *: every day of the week # # 'curl -s': Executes a silent HTTP request (no progress bar or error messages on stdout). # '> /dev/null 2>&1': Redirects all output (standard output and standard error) to /dev/null. # This prevents cron from sending you emails for every successful execution. * * * * * curl -s "change_with_your_uptime_kuma_push_url" > /dev/null 2>&1 -
press
ctrl + xthenyto save the config. -
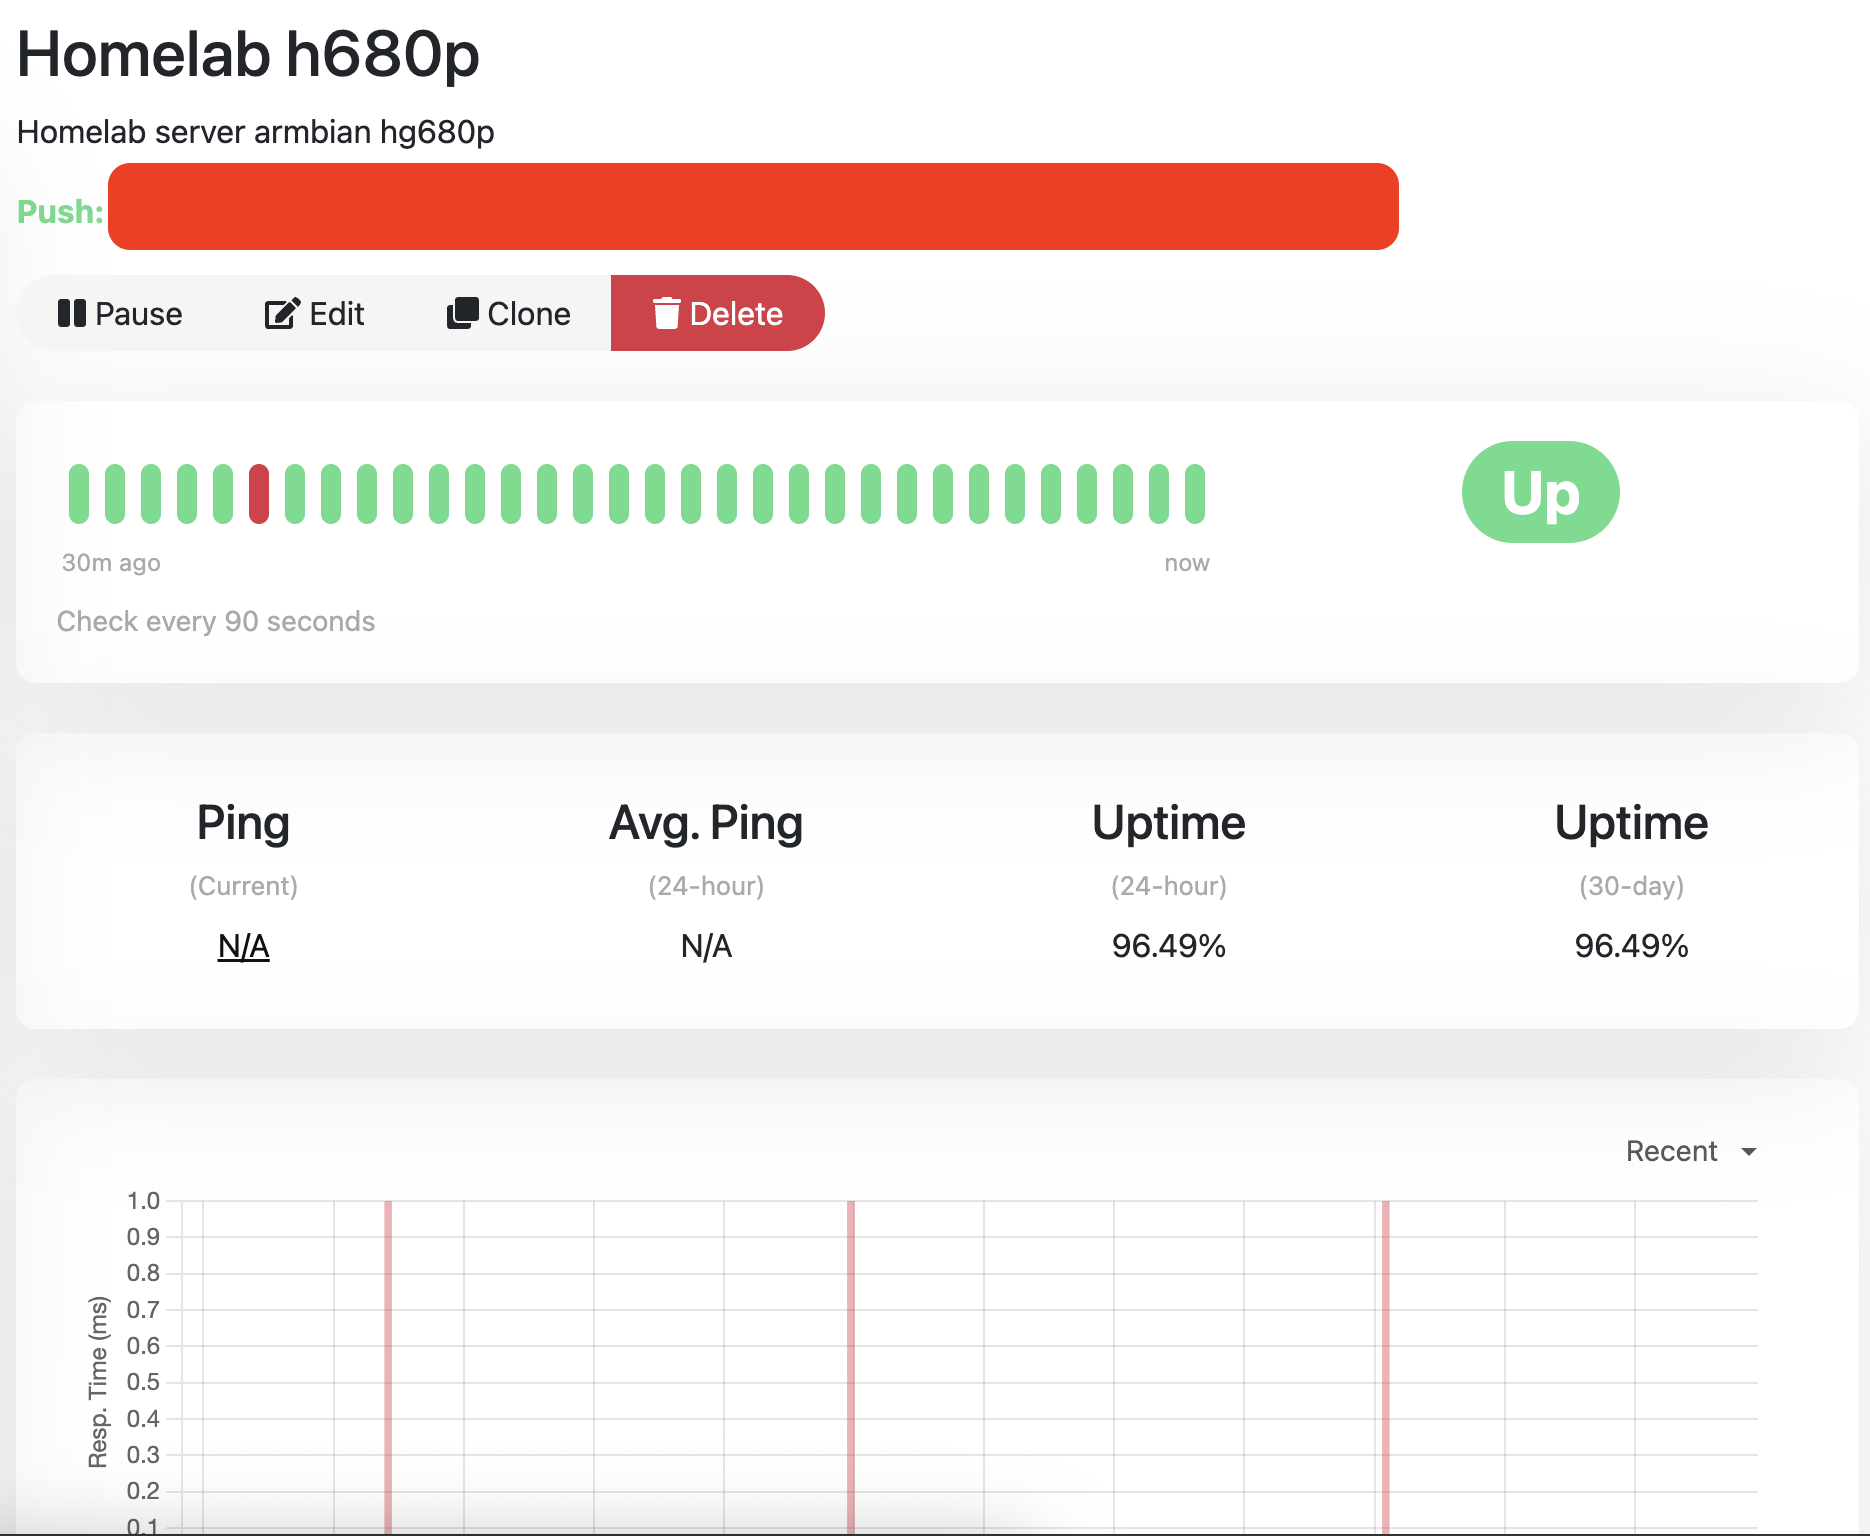
Now, go back to your Uptime Kuma dashboard, set the interval, and save it.
-
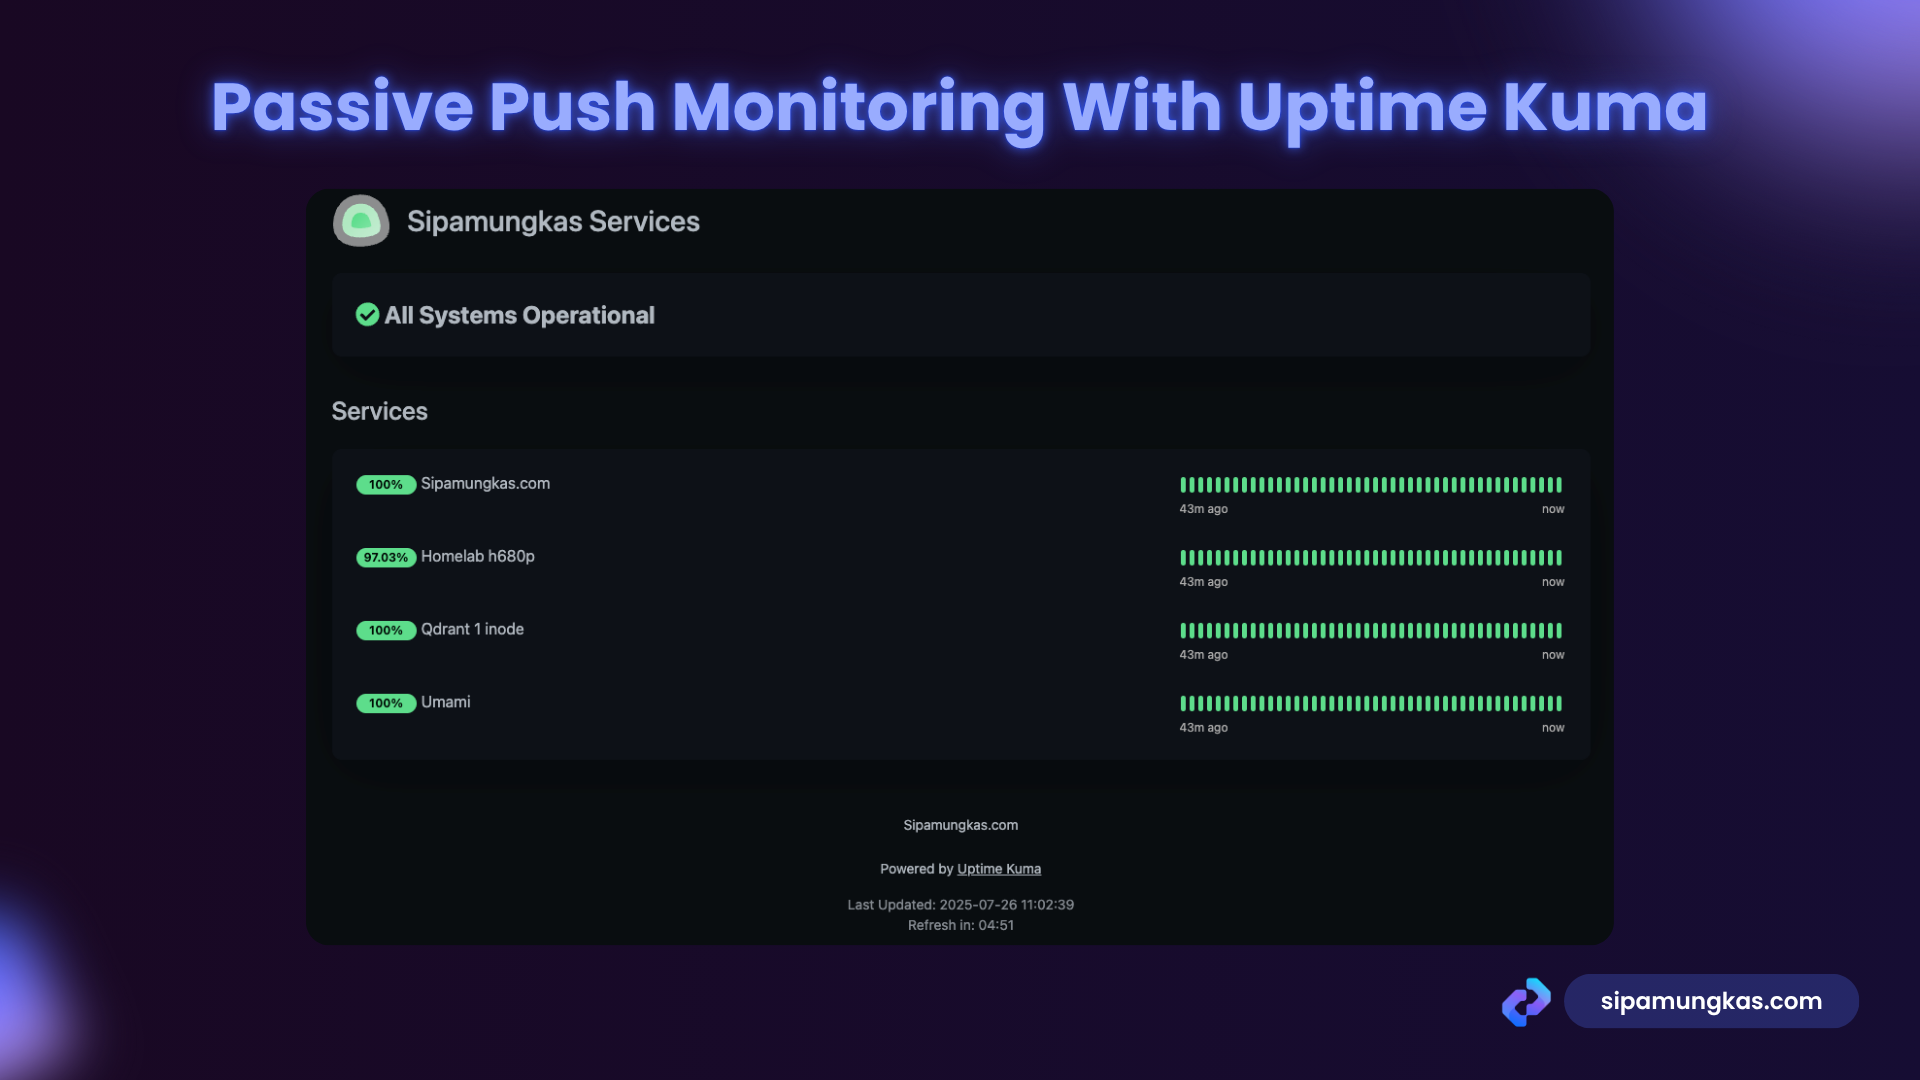
Congratulations! You have your passive push monitoring on uptime kuma running
What’s Next?
This article only discusses the basics; you can expand it further, like modifying the ping and status message. Or even create an advanced bash script that fails 3 times, sends the error. and call the bash script in the crontab instead of using curl and a URL.
Finally
Thank you for reading this far!
The one who writes does not necessarily possess more knowledge than the one who reads.
Tidaklah yang menulis lebih berilmu daripada yang membaca.